UX Case Study
AI Simplified for Complex Challenges.
Vinod Chelmeda
Please Note
The following case study is based on a real-life project. To maintain confidentiality as per the signed non-disclosure agreement, the names, logos, and certain details have been altered.
Project Overview
Raya is an AI-powered assistant feature of the Regins Fusion Suite application, designed to make accessing regulatory information effortless. With advanced conversational AI and powerful data visualizations, Raya delivers actionable insights in seconds, simplifying workflows and empowering smarter decision-making.
Overview of Regins Fusion

Regins Fusion unites all regulatory needs into one smart system. It delivers real-time health authority updates, supports management of products, submissions, and applications, and enables seamless tracking of compliance activities. Designed for efficiency and collaboration, Regins Fusion ensures businesses stay informed, compliant, and focused on growth.
My Role & Responsibilities
As a UI/UX Designer, my role involved conducting user interviews, creating personas, defining information architecture, designing wireframes and prototypes, performing usability testing, and establishing a consistent design system.
Tools

Final Product
This final product is a result of many tests made by the team. We could solve most of the problems we were facing, plus add some interesting functions inspired by concurrent systems.
Problem Statement
In today’s fast-paced digital environment, users struggle to access critical information quickly and efficiently. Current tools are complex, requiring users to navigate multiple steps and perform repetitive manual tasks to gather data and create charts, timelines, or tables. Creating these visuals often involves exporting data to external tools like Excel, formatting it manually, and cross-referencing information—an error-prone and time-consuming process.
These inefficiencies not only waste valuable time but also increase frustration and detract from higher-value tasks. There’s a critical need for a unified, intelligent assistant that delivers precise and actionable insights—text, data, or visuals—directly in response to a single user prompt, reducing effort, clicks, and cognitive load.
Possible Solution
Raya is an AI-powered assistant integrated into a regulatory suite available on both web and mobile platforms. It simplifies access to critical information by providing instant, actionable insights through a single user prompt.
The assistant leverages conversational AI and generative AI to deliver text-based responses and dynamic visualizations, such as tables and charts. It enables users to quickly retrieve information related to regulatory updates, product details, applications, registrations, submissions, health authority guidelines, RTQs, and more, without navigating through complex menus or performing multiple searches.
Design Process (Design Thinking)
Design Thinking is a methodology that provides a solution-focused approach to solving problems. This process involves deeply understanding users, redefining problems based on user insights, brainstorming, and ideating creative solutions through iterative design.

Empathize
Quantitative Research
Qualitative Research
Competitor Analysis

Define
User Personas
User Journey
Empathy Mapping
How Might We

Ideate
Information Architecture
User flow

Design
Low Fidelity
High Fidelity
Prototype
Test
Usability Testing
*
Phase #1
*

Empathize
Qualitative Research
The qualitative research process involved in-depth user interviews to understand workflows, challenges, and expectations. The focus was on identifying pain points in current tools, exploring manual inefficiencies, and uncovering user needs for smarter, AI-driven solutions. This approach provided valuable insights into how users interact with regulatory systems, their visualization demands, and their preference for personalized, intuitive, and consistent experiences across devices.

Questions
Can you walk me through your daily workflow?
What do you like and dislike about your current tool or the process to get information from the tool?
What challenges do you face when trying to find specific information?
Can you describe a situation where finding information took longer than expected?
Do you create charts, tables, or other visuals for your work? If so, how do you create them?
If you had an intelligent assistant, what kind of tasks or queries would you expect it to handle?
What kind of data visualizations (e.g., charts, table) are most helpful to you? Why?
Do you primarily work on a desktop, laptop, or mobile device?
Have you used conversational AI tools (e.g., chatbots, assistants) in the past? If so, what was your experience?
How important is it for the system to remember your preferences or provide tailored suggestions?
Insights
Complex Workflows: Users perform a wide variety of tasks daily, such as organizing regulatory information, creating reports, and visualizing data, often facing inefficiencies in these processes.
Tool Limitations: While users find their tools comprehensive, they cite issues like a lack of intuitive interfaces and challenges in accessing information quickly, especially without natural-language capabilities.
Manual Reporting Burden: Report creation, especially visualizations like charts and timelines, involves manual processes that are time-consuming and prone to errors.
AI Expectations: Users expect AI to streamline workflows by providing contextual insights, handling follow-up queries, and automating repetitive tasks.
Visualization Demands: Timelines, progress comparisons, and summary tables are essential for decision-making but are hard to generate quickly.
Mobile Limitations: Mobile interfaces are less functional, with a demand for consistent user experiences across devices.
Personalization Needs: Users desire systems that adapt to preferences, offering tailored suggestions to save time and effort.
Quantitative Research
This survey examines the frequency and types of regulatory information searches, time spent on data gathering, and issues with incomplete data. It assesses user preferences for search methods, cross-platform consistency, and trust in AI-powered assistants. The goal is to improve accessibility and usability by understanding search frequency, data gathering time, and user trust in AI. Findings will inform the development of more effective systems.
How often do you need to look up regulatory information?
30.00%
60.00%
10.00%
Daily
Weekly
Monthly
What types of information do you most frequently search for?
40.00%
20.00%
30.00%
10.00%
Regulatory Information
Submission Statuses
Product Information
Product Registrations
How much time do you typically spend gathering and organizing data for reports or analysis?
10.00%
60.00%
30.00%
Less than 15 minutes
15–60 minutes
Over an hour
Have you ever encountered issues with incomplete or outdated information?
40.00%
60.00%
Yes
No
Would you find natural-language queries (e.g., typing a question) more helpful than traditional keyword searches?
90.00%
10.00%
Yes
No
Would you trust an AI-powered assistant to provide regulatory insights?
15.00%
85.00%
Yes
No
How important is it for you to receive both text-based and visual responses?
40
30
20
10
0
1
2
3
4
5
Overall Rating : 4.7
How consistent do you expect the experience to be between web and mobile platforms?
40
30
20
10
0
1
2
3
4
5
Overall Rating : 4.5
Competitive Analysis
We conducted a competitive analysis to understand how Promptly compares with existing tools like Veva Vaault and Riggi. This helped identify unique opportunities where Raya could excel, such as offering dynamic visualizations, conversational AI, and user-friendly cross-platform experiences, addressing key gaps in the market.
Strengths:
Industry-standard tool with extensive compliance features.
Robust search functionality for structured queries.
Tailored for specific regulatory needs in life sciences.
Weaknesses:
High cost of adoption and maintenance.
Steep learning curve for new users.
Limited flexibility for other industries
Mobile experience lacks efficiency.
Veva Vaault
Riggi
Strengths:
Leverages AI for natural language searches and jurisdictional tracking.
Effective for compliance teams across multiple industries.
Moderate learning curve with simplified interface.
Weaknesses:
Limited visual data tools; focuses on text summaries and mapping.
Lacks versatility for non-compliance-related use cases.
Mobile usability is underdeveloped compared to desktop.
Strengths:
Dynamic, rich visualizations (charts, tables, timelines).
Conversational AI simplifies complex workflows.
Offers seamless cross-platform experiences (desktop & mobile).
Highly customizable with tailored suggestions and preference saving.
Broad appeal across industries beyond regulatory compliance.
Weaknesses:
Relatively new; scalability and advanced features still under development.
Competitive Landscape: Feature Comparison
Features
Veva Vaault
Riggi
Raya
Target Audience
Regulatory professionals in life sciences.
Compliance teams in legal and regulatory sectors.
Broad: regulatory teams, analysts, and professionals seeking quick insights.
Search Functionality
Advanced but keyword-focused.
Natural language for laws/regulations.
Conversational, cross-platform AI queries.
Customization
Limited flexibility, life sciences-focused.
Compliance-oriented.
Highly adaptable, with user preferences.
Data Visualization
Basic dashboards.
Limited to text and jurisdiction mapping.
Dynamic charts, timelines, and tables.
Cross-Platform
Desktop-first, mobile less intuitive.
Primarily desktop, basic mobile support.
Seamless, optimized for web and mobile.
Ease of Use
Complex for new users.
Moderate simplicity.
Intuitive conversational interface.
Empathize Phase Key Takeaways:
Key Insights, Pain Points, and User Needs
Key Insights
Comprehensive Data Availability : Users appreciate the completeness of their current tools but find the navigation and access challenging.
High Frequency of Use : 60% of users need to access regulatory information weekly, emphasizing the importance of efficiency and ease of use.
Significant Time Investment : 60% spend 15–60 minutes, and 30% spend over an hour gathering data, pointing to inefficiency in the current tools.
Preference for Natural Language Queries : 90% of users prefer natural language queries, highlighting the need for an intuitive and conversational interface.
Demand for Visual and Textual Insights : An average importance rating of 4.7/5 for receiving both text-based and visual responses underscores the value of clear and actionable outputs like charts and tables.
More...
Pain Points
Difficulty Navigating Tools : Users struggle with excessive clicks and poor search functionality, leading to frustration and delays, Information is deeply nested, making it hard to locate quickly.
Manual Creation of Visuals : Users rely on Excel for creating charts and tables, which is repetitive and prone to errors.
Limited Mobile Usability : Mobile platforms lack features and are less user-friendly, especially for detailed data visualization.
More...
User Needs
Faster Access to Relevant Information : A streamlined system that reduces the time and effort required to locate and organize regulatory data.
Advanced Search and Query Handling : A tool capable of understanding natural language queries and providing precise, contextually relevant results.
Dynamic Visuals Generation : Built-in capabilities to generate charts, tables, and timelines directly from data inputs to reduce manual work.
Personalized and Adaptive Features : A system that remembers user preferences and provides tailored suggestions to improve efficiency.
Seamless Multi-Platform Experience : Consistency across web and mobile platforms for uninterrupted access to regulatory information.
More...
*
Phase #2
*

Define
User Personas: Designing for Real-World Needs
I created detailed user personas to ensure the design decisions were informed by a deep understanding of the users’ goals, behaviors, and challenges. These personas represent the target audience and help in visualizing how they interact with the product. By empathizing with users, we can tailor features that directly address their needs and pain points, I identified three core user types: Senior Executive, Compliance Manager, Regulatory Affairs Professional

Compliance Manager

Regulatory Affairs Professional

Senior Executive

Amanda Chen
Senior Executive
48
London, UK
MD
Vice President of Regulatory Affairs
About
Amanda oversees the regulatory affairs department for a multinational medical device company. She needs to stay informed about high-level regulatory statuses across the company’s portfolio and use this information to align resources and strategy. She values concise, actionable insights.
Goals
Quickly access key metrics and summaries without diving into operational details.
Align regulatory strategies with organizational goals.
Make informed decisions based on reliable, real-time insights.
Frustrations
Overwhelmed by excessive data and long reports that obscure key insights.
Difficulty accessing consolidated, real-time data for quick decision-making.
Reliance on teams to create manual summaries for meetings.
Technology Usage
Devices: Primarily works on a laptop but frequently uses a tablet or mobile for meetings.
Familiarity with AI: High – interested in tools that enhance productivity and reduce manual effort.
Preferred Features: Executive dashboards, pre-generated summaries, and visual KPIs.
Scenario
Amanda has a board meeting in an hour and needs to present the status of product registrations in major markets. She relies on her team to prepare a report, and she must manually adjust the data before presenting.
Marcus Lee
Compliance Manager
41
Singapore
CCEP
Quality Assurance Specialist
About
Marcus is responsible for ensuring that his organization meets all regulatory requirements globally. He frequently monitors compliance tasks, tracks regulatory updates, and liaises with different teams to address compliance gaps. He values tools that consolidate information and support proactive compliance management.
Goals
Stay informed about regulatory changes from all relevant health authorities.
Easily identify and track compliance risks.
Generate reports for audits or leadership with minimal effort.
Frustrations
Missing critical updates due to fragmented information sources.
Limited mobile usability when traveling for audits or meetings.
Spending too much time consolidating compliance data from different regions.
Technology Usage
Devices: Uses both a desktop and a mobile device; mobile access is critical during audits.
Familiarity with AI: Low – skeptical of chatbots but open to trying advanced tools.
Preferred Features: Real-time alerts, compliance dashboards, and tailored compliance checklists.
Scenario
Marcus is preparing for an internal compliance audit and needs to consolidate recent regulatory updates for five different markets. The process involves manually reviewing emails, online databases, and spreadsheets, which is both time-consuming and prone to oversight.

Rachel Turner
Regulatory Affairs Professional
34
Boston, USA
MBA
Regulatory Affairs Specialist
About
Rachel works in a fast-paced pharmaceutical company, managing regulatory submissions across multiple countries. Her role involves tracking deadlines, responding to regulatory questions, and ensuring that all submissions comply with health authority requirements. Rachel is detail-oriented and values tools that make her job more efficient.
Goals
Reduce the time spent searching for submission data or product registration details.
Ensure compliance by having access to accurate, up-to-date information.
Simplify the process of preparing charts and tables for internal reporting.
Frustrations
Search tools that require exact keywords instead of understanding natural queries.
Manually creating visuals in Excel is tedious and prone to errors.
Delays caused by having to cross-reference multiple sources for submission updates.
Technology Usage
Devices: Primarily works on a desktop at the office but occasionally uses her mobile for quick updates.
Familiarity with AI: Moderate – has used basic chatbots but finds them too limited.
Preferred Features: Advanced search, visual dashboards, and tailored insights.
Scenario
Rachel is working on a submission for a new drug in multiple countries. She needs to check the registration status across regions and generate a timeline for upcoming deadlines. It takes her hours to pull the information together and create a visual summary for her team.
Says
Thinks
I need a faster way to find submission statuses.
It’s frustrating to create charts manually every time.
I just want accurate, up-to-date information.
If I can’t find the data quickly, I’ll miss deadlines.
This tool should work with natural language, not keywords.
Visualizations would save me hours.
Overwhelmed by repetitive tasks.
Anxious about compliance risks.
Frustrated with clunky interfaces.
Spends hours cross-referencing tabs and reports.
Creates visuals in Excel for reporting.
Frequently revisits the same data sources manually.
Does
Feels
2 More...
Empathy Map
How Might We (HMW)
HMW simplify workflows for regulatory professionals?
HMW enhance the accuracy and efficiency of creating reports and visualizations?
HMW ensure users can access critical information quickly and intuitively?
HMW improve the usability of tools across different platforms, especially on mobile devices?
HMW ensure compliance managers stay updated with global regulatory changes?
*
Phase #3
*

Ideate
User Flow
I took Amanda (Senior Executive) one use case scenario to show the flow.
Use case: Amanda has a board meeting in an hour and needs to present the active products registered in specific markets by categorizing them with product category.
Current User Flow
Login
Home Page
Opens Registrations
Apply filters on county column i.e. Armenia, Austria, Belgium, India,
Spain, Sweden
Apply filters on Registration status
column i.e. Active
Manually Copy the product details into excel sheet
Create Tables or Charts from the excel
sheet and Place in PPT to Present
New User Flow
Login
Raya Page
Enter Prompt
Show me list of products categorized by product category registered in countries :
Armenia, Austria, Belgium, India, Spain, Sweden in Table format.
Download/Copy Charts
and Tables and Place in PPT to Present
*
Phase #4
*

Design
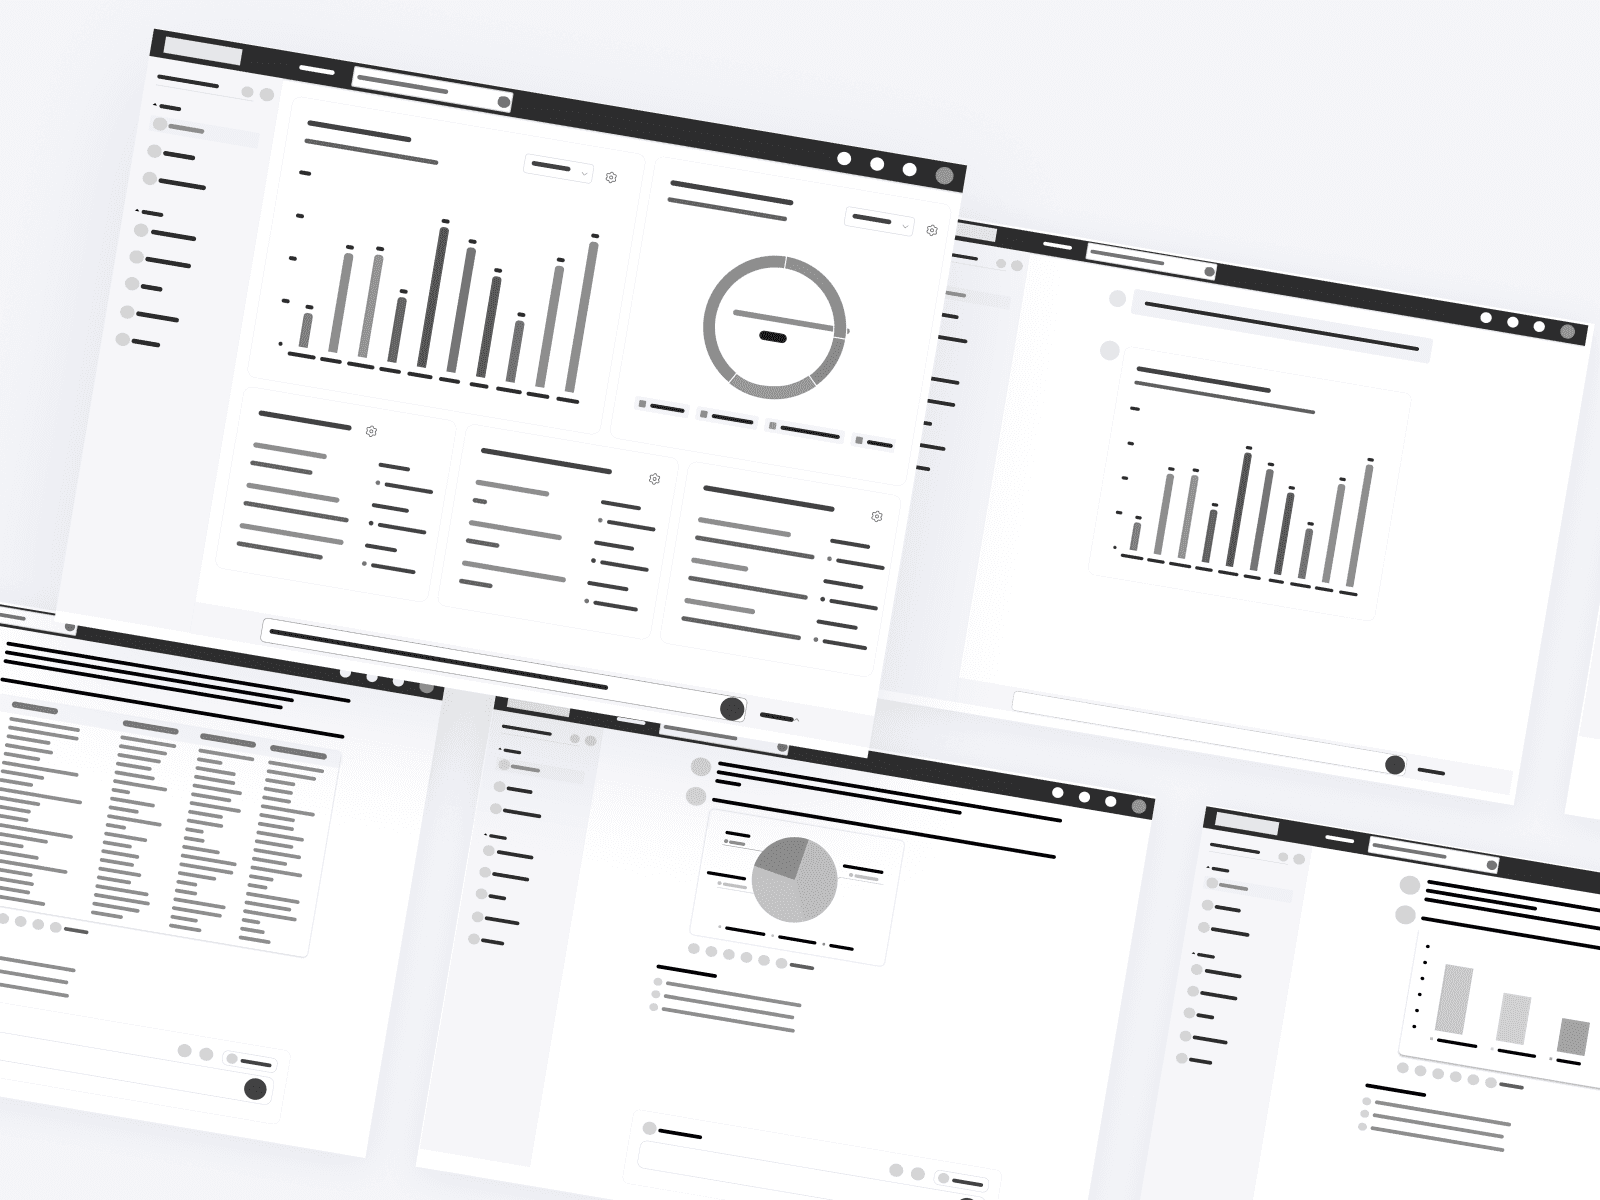
Low Fidelity Screens
High Fidelity Screens
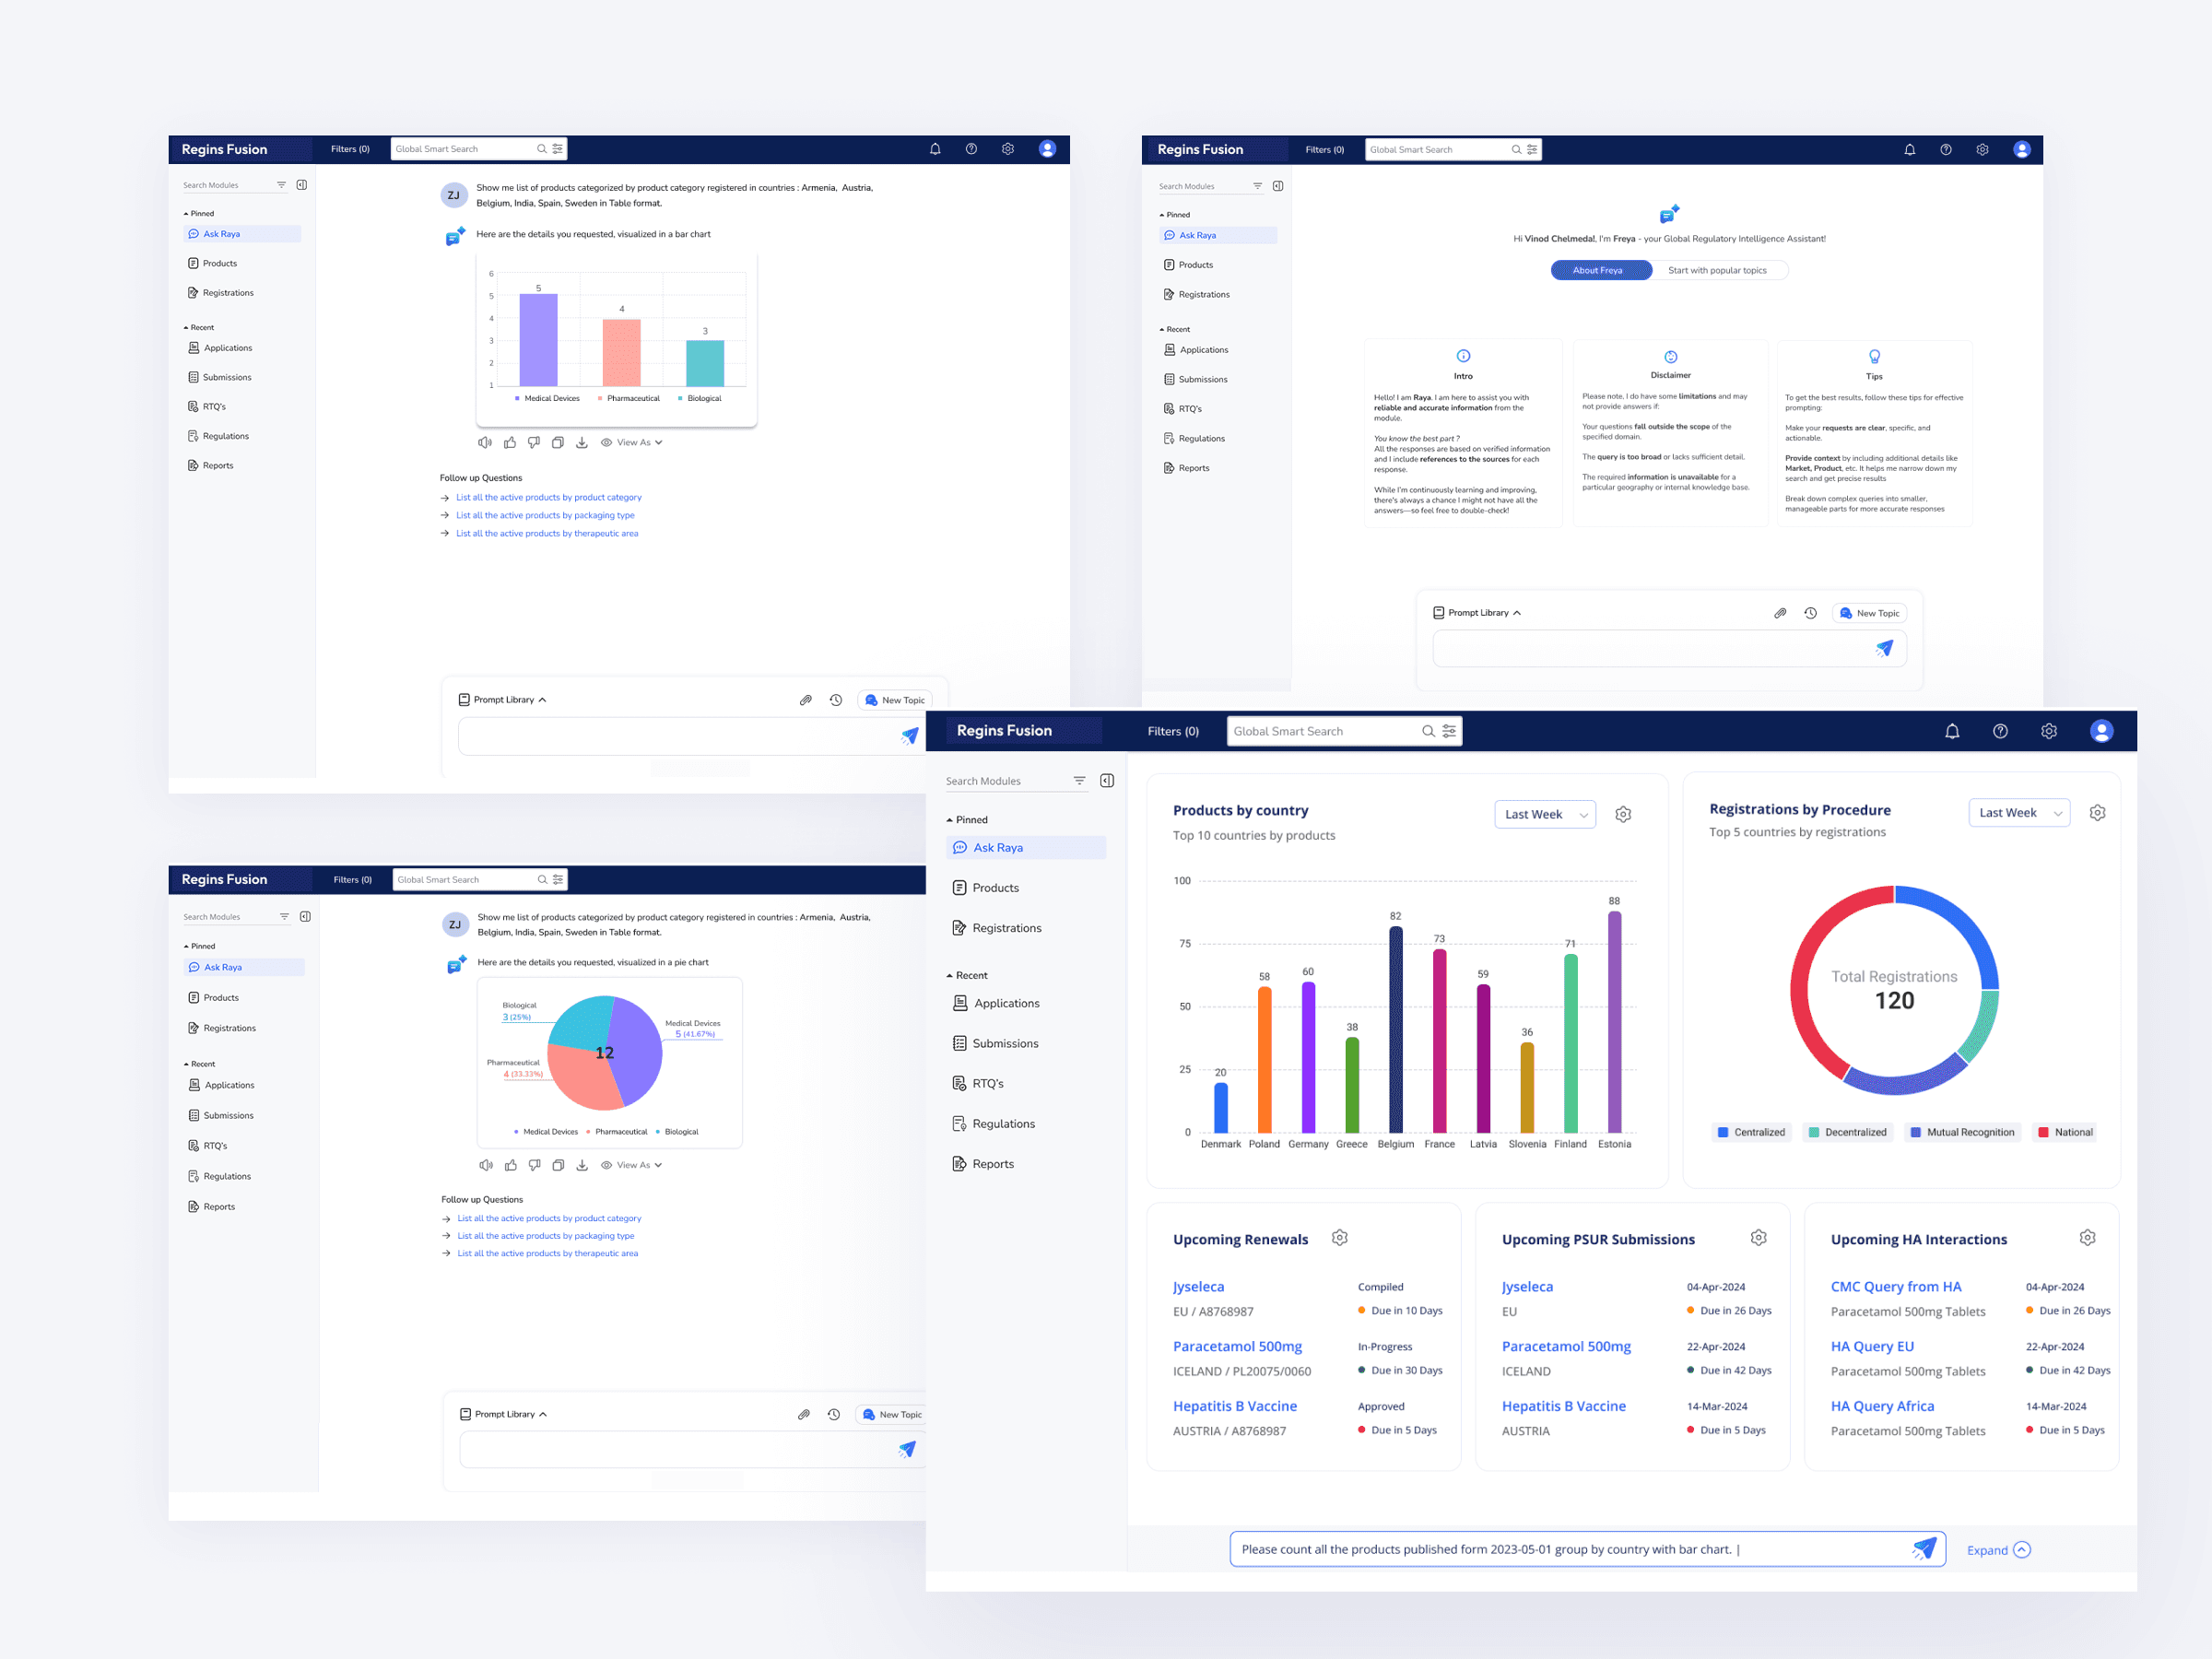
Final Prototype
Prototype Link: Raya
Impact and Outcomes
🎉🥳🎊
The implementation of Raya, the AI-powered assistant integrated into the Regins Fusion Suite, achieved significant improvements in user efficiency, satisfaction, and overall productivity. Key performance indicators (KPIs) demonstrate the effectiveness of the solution:
User Adoption and Engagement
40% increase in active users within the first three months.
85% of users regularly used the natural language query feature, showcasing strong engagement with the core functionality.
Time Saved in Workflow
30-45% time savings in gathering and organizing regulatory data.
50% reduction in time to retrieve regulatory information and updates, streamlining decision-making and reducing manual effort.
User Satisfaction and Feedback
SUS score of 85 in usability testing, indicating high user satisfaction with the intuitive interface and fast response times.
50% reduction in time to retrieve regulatory information and updates, streamlining decision-making and reducing manual effort.
Adoption Rate of AI Features
90% of users adopted the natural language query feature within the first month, showing preference for the intuitive, AI-powered search experience.
Reduction in Manual Reporting Tasks
70% reduction in time spent on generating reports and visualizations. Automated chart and table generation replaced manual processes, leading to significant time savings.
Thank You
For Watching